Extreme Elastic Schedule Solution Based on HPA and WorkloadSpread
Since 0.10.0 version,OpenKruise have proposed a multi-domain CRD with by-pass architecture, namely, WorkloadSpread. WorkloadSpread allows a Workload to distribute its Pods to different node, zone, even different clusters and providers, as well as to apply differential configurations in different domains.This CRD can give Workloads the ability of multi-domain scatter, elastic schedule and fine management in a non-intrusive manner.
In this page, we will take a simple web application as an example to help users build an automatic extreme elastic scheduling solution, combining with WorkloadSpread, KEDA, Prometheus and Alibaba Cloud Elastic Instances (ECI).
Introduction
Architecture
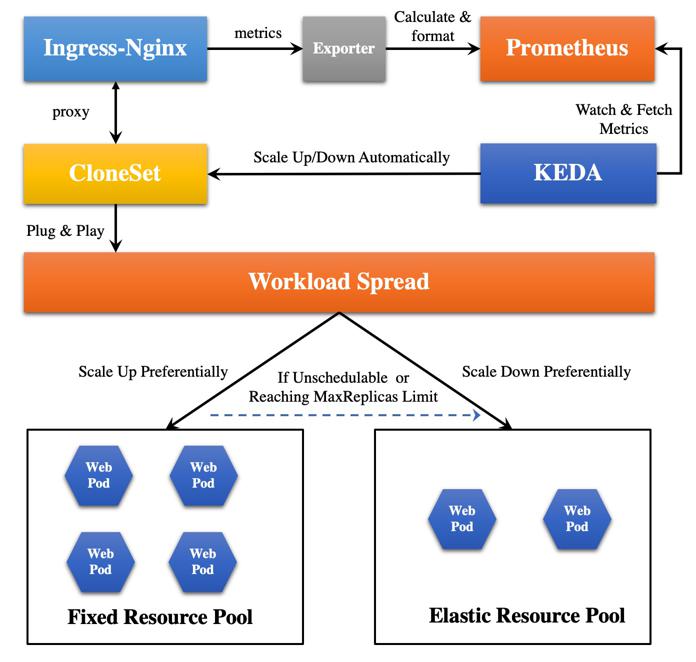
The architecture of this solution is as follows:
Special Note:
-
In the solution, the HPA configuration is managed by KEDA. KEDA is an enhanced autoscaling component based on HPA. Compared with the native HPA, KEDA has much richer user-defined metrics.
-
We take a trick that the metrics of Nginx instead of Web Pod are collected, because we want to reuse the open-source Nginx-Prometheus-Exporter to simplify this solution. It's easier to use this exporter to explore the number of https links and other metrics. Most importantly, the traffic entering the Web Pod must go through the Nginx Ingress. Therefore, we are going to directly use the metrics of Nginx, and combine KEDA to implement the automatic scale feature.
-
At least version 1.21 is required by WorkloadSpread to manage Deployment, but ACK Kubernetes clusters currently supports up to version 1.20. Therefore, we have to take CloneSet as an example in this architecture.
Goals
Our goal is to fully automate the following actions:
-
When the traffic exceeded the threshold within a certain time window (the traffic here is defined as the smooth number of http connections per second, which can be defined according to actual needs), it will scale up replicas automatically;
- When scaling up, the higher priority will be given to the fixed resource pool to schedule pod. When the fixed resource pool is insufficient or reached the
MaxReplicaslimit, the Pods will be automatically scheduled to the elastic resource pool;
- When scaling up, the higher priority will be given to the fixed resource pool to schedule pod. When the fixed resource pool is insufficient or reached the
-
When the traffic is lower than the threshold, it will scale down replicas automatically;
- When scaling down, the Pods in the elastic resource pool will be deleted first.
Dependency Installation
We use a ACK Kubernetes Cluster with 3 ECS nodes and 1 Virtual-Kubelet (VK) node. ECS nodes correspond to the fixed resource pool, and VK node corresponds to the elastic resource pool.
$ k get node
NAME                         STATUS   ROLES    AGE    VERSION
us-west-1.192.168.0.47       Ready    <none>   153d   v1.20.11-aliyun.1
us-west-1.192.168.0.48       Ready    <none>   153d   v1.20.11-aliyun.1
us-west-1.192.168.0.49       Ready    <none>   153d   v1.20.11-aliyun.1
virtual-kubelet-us-west-1a   Ready    agent    19d    v1.20.11-aliyun.1
Installing OpenKruise
More details can be found in official installation document. We recommend installing the latest version OpenKruise.
Installing KEDA
KEDA is a Kubernetes-based event driven autoscaling component. It provides event driven scale for any container running in Kubernetes.
$ helm repo add kedacore https://kedacore.github.io/charts

$ helm repo update

$ kubectl create namespace keda

$ helm install keda kedacore/keda --namespace keda
Installing Ingress-Nginx-Controller
Firstly,Creating namespace:
$ kubectl create ns ingress-nginx
Because this exporter needs to access the Nginx status API to get the number of http connections information, it is necessary to apply a ConfigMap related to the Nginx configuration before the installation, so as to expose the Nginx status API for the consumption by Nginx-Prometheus-Exporter:
apiVersion: v1
data:
  allow-snippet-annotations: "true"
  http-snippet: |
    server {
      listen 8080;
      server_name _ ;
      location /stub_status {
        stub_status on;
      }

      location / {
        return 404;
      }
    }
kind: ConfigMap
metadata:
  annotations:
    meta.helm.sh/release-name: ingress-nginx
    meta.helm.sh/release-namespace: ingress-nginx
  labels:
    app.kubernetes.io/component: controller
    app.kubernetes.io/instance: ingress-nginx
    app.kubernetes.io/managed-by: Helm
    app.kubernetes.io/name: ingress-nginx
    app.kubernetes.io/version: 1.1.0
    helm.sh/chart: ingress-nginx-4.0.13
  name: ingress-nginx-controller
  namespace: ingress-nginx
Prepare a values Yaml file to expose port 8080 when applying Ingress-Nginx controller deployment:
# values.yaml
controller:
  containerPort:
    http: 80
    https: 443
    status: 8080
installing Ingress-Nginx controller:
$ helm upgrade --install ingress-nginx ingress-nginx --repo https://kubernetes.github.io/ingress-nginx --namespace ingress-nginx --values values.yaml
80 and 443 ports provide services for external users via LoadBalancer type service, whereas the 8080 port is only used by internal exporter. Because the exporter and Prometheus can be deployed in the cluster, and they only provides services internally, therefore, the ClusterIP type service should be used to connect to the Nginx 8080 port, making it exposed only within the cluster:
kind: Service
apiVersion: v1
metadata:
  name: ingress-nginx-controller-8080
  namespace: ingress-nginx
spec:
  selector:
    app.kubernetes.io/component: controller
    app.kubernetes.io/instance: ingress-nginx
    app.kubernetes.io/name: ingress-nginx
  type:  ClusterIP
  ports:
  - name: myapp
    port:  8080
    targetPort: status
Installing Nginx-Prometheus-Exporter
The status data exposed by Nginx does not follow the standard of Prometheus, so an exporter component is required for the data collection and format conversion. Here, we use Nginx-Prometheus-Exporter, which is provided by nginx community:
apiVersion: apps/v1
kind: Deployment
metadata:
  name: ingress-nginx-exporter
  namespace: ingress-nginx
  labels:
    app: ingress-nginx-exporter
spec:
  selector:
    matchLabels:
      app: ingress-nginx-exporter
  strategy:
    rollingUpdate:
      maxSurge: 1
      maxUnavailable: 1
    type: RollingUpdate
  template:
    metadata:
      labels:
        app: ingress-nginx-exporter
    spec:
      containers:
      - image: nginx/nginx-prometheus-exporter:0.10
        imagePullPolicy: IfNotPresent
        args:
        - -nginx.scrape-uri=http://ingress-nginx-controller-8080.ingress-nginx.svc.cluster.local:8080/stub_status
        name: main
        ports:
        - name: http
          containerPort: 9113
          protocol: TCP
        resources:
          limits:
            cpu: "200m"
            memory: "256Mi"
Installing Prometheus-Operator
$ helm repo add prometheus-community https://prometheus-community.github.io/helm-charts

$ helm repo update

$ helm install [RELEASE]  prometheus-community/kube-prometheus-stack --namespace prometheus --create-namespace
The [RELEASE] used by us in the above command is kube-prometheus-stack-1640678515. This string determines some subsequent configurations. If it changed, the configurations of subsequent yaml files will also need to be changed.
After the installation of Prometheus, the following ServiceMonitor should be applied to monitor the status exposed by Ingress-Nginx:
apiVersion: monitoring.coreos.com/v1
kind: ServiceMonitor
metadata:
  labels:
    release: kube-prometheus-stack-1640678515
  name: ingress-nginx-monitor
  namespace: ingress-nginx
spec:
  selector:
    matchLabels:
      app: ingress-nginx-exporter
  endpoints:
  - interval: 5s
    port: exporter
Correctness Check
After the above dependency installation and configuration is completed, we need to check the correctness of them first.
Checking whether Nginx Status API is usable
Firstly, we apply a simple pod with /bin/sh and curl tools.
apiVersion: v1
kind: Pod
metadata:
  name: centos
  namespace: ingress-nginx
spec:
  containers:
  - name: main
    image: centos:latest
    command: ["/bin/sh", "-c", "sleep 100000000"]
Then, execute kubectl exec command into this main container, and try to request the nginx status API by executing curl:
$ k exec busybox -n ingress-nginx -it -- /bin/sh

sh-4.4# curl -L http://ingress-nginx-controller-8080.ingress-nginx.svc.cluster.local:8080/stub_status

Active connections: 6
server accepts handled requests
 12092 12092 23215
Reading: 0 Writing: 1 Waiting: 5
If similar content is output after the above curl command is executed, it indicates that this API is usable.
Checking Whether Prometheus is usable
When we installed Prometheus operator using Helm, we also installed Grafana, a visual tool. Therefore, we can login to Grafana to check whether the metrics of Nginx we want have been collected.
Because Grafana is also deployed in the ACK cluster, if you want to use the local browser to access Grafana, you need to change the Grafana Service Type to LoadBalancer, so that ACK will automatically assign an external IP to Grafana. With this external IP, you can access Grafana using your local browser. The default user and password of Grafana can be parsed from the corresponding Secret:
user: admin
password: prom-operator
After logging into Grafana, click Explore in the navigation bar on the left, and you can see the list of Metrics collected and stored by Prometheus if you click the Metrics Browser. If the Metrics we pay attention to exist, it means that the configuration is correct.
Deployment
After the above environment is ready and everything is confirmed to be usable, then you can deploy the hello-web applications and elastic components.
Deploying Application
We’re going to deploy the hello-web application. If you access this application, it will return a simple HTML page with similar contents as follows:
Hello Web
Current Backend Server Info
Server Name: hello-web-57b767f456-bnw24
Server IP: 47.89.252.93
Server Port: 80
Current Client Request Info
Request Time Float: 1640766227.537
Client IP: 10.64.0.65
Client Port: 52230
User Agent: Mozilla/5.0 (Macintosh; Intel Mac OS X 10_15_7) AppleWebKit/537.36 (KHTML, like Gecko) Chrome/90.0.4430.212 Safari/537.36
Request Method: GET
Thank you for using PHP.
Request URI: /
Deploying Application using CloneSet:
apiVersion: apps.kruise.io/v1alpha1
kind: CloneSet
metadata:
  name: hello-web
  namespace: ingress-nginx
  labels:
    app: hello-web
spec:
  replicas: 1
  selector:
    matchLabels:
      app: hello-web
  template:
    metadata:
      labels:
        app: hello-web
    spec:
      containers:
      - name: hello-web
        image: zhangsean/hello-web
        ports:
        - containerPort: 80
        resources:
          requests:
            cpu: "1"
            memory: "256Mi"
          limits:
            cpu: "2"
            memory: "512Mi"
---
kind: Service
apiVersion: v1
metadata:
  name: hello-web
  namespace: ingress-nginx
spec:
  type: ClusterIP
  selector:
    app: hello-web
  ports:
  - protocol: TCP
    port: 80
    targetPort: 80
---
apiVersion: networking.k8s.io/v1
kind: Ingress
metadata:
  name: ingress-web
  namespace: ingress-nginx
spec:
  rules:
  - http:
      paths:
      - path: /
        pathType: Prefix
        backend:
          service:
            name: hello-web
            port:
              number: 80
  ingressClassName: nginx
Deploying WorkloadSpread
apiVersion: apps.kruise.io/v1alpha1
kind: WorkloadSpread
metadata:
  name: workloadspread-sample
  namespace: ingress-nginx
spec:
  targetRef:
    apiVersion: apps.kruise.io/v1alpha1
    kind: CloneSet
    name: ingress-nginx-controller
  scheduleStrategy:
    type: Adaptive
    adaptive:
      rescheduleCriticalSeconds: 2
  subsets:
  - name: fixed-resource-pool
    requiredNodeSelectorTerm:
      matchExpressions:
        - key: type
          operator: NotIn
          values:
          - virtual-kubelet
    patch:
      metadata:
        labels:
          resource-pool: fixed
  - name: elastic-resource-pool
    requiredNodeSelectorTerm:
      matchExpressions:
        - key: type
          operator: In
          values:
          - virtual-kubelet
    tolerations:
    - effect: NoSchedule
      key: virtual-kubelet.io/provider
      operator: Exists
    patch:
      metadata:
        labels:
          resource-pool: elastic
The above WorkloadSpread configuration contains two subsets, which correspond fixed resource pool and elastic resource pool. We expect the CloneSet named hello-web to schedule its Pods to the fixed resource pool preferentially, and then to the elastic resource pool if the resource pool is unschedulable.
When APIServer receives a corresponding pod creation request, it will call kruise Webhook to inject the scheduling rules of the WorkloadSpread. The injection strategy is append instead of replace. For example, if Pod itself had 'requiredNodeSelectorterm' or 'Tolerations', WorkloadSpread will append its scheduling rules to the end of 'requiredNodeSelectorterm' or 'Tolerations' of the Pod.
Therefore, we suggest:
-
Write the common and immutable scheduling rules to workload.
-
Write the customized scheduling rules to the WorkloadSpread subset.
Deploying ScaleObject
apiVersion: keda.sh/v1alpha1
kind: ScaledObject
metadata:
  name: ingress-nginx-scaledobject
  namespace: ingress-nginx
spec:
  maxReplicaCount: 10
  minReplicaCount: 1
  pollingInterval: 10
  cooldownPeriod:  2
  advanced:
    horizontalPodAutoscalerConfig:
      behavior:
        scaleDown:
          stabilizationWindowSeconds: 10
  scaleTargetRef:
    apiVersion: apps.kruise.io/v1alpha1
    kind: CloneSet
    name: hello-web
  triggers:
  - type: prometheus
    metadata:
      serverAddress: http://kube-prometheus-stack-1640-prometheus.prometheus:9090/
      metricName: nginx_http_requests_total
      query: sum(rate(nginx_http_requests_total{job="ingress-nginx-exporter"}[12s]))
      threshold: '100'
Demo Show
Firstly, make sure that all the configurations have been applied:
Then, use go-stress-testing to do pressure test for hello-web application.
When the first traffic peak comes,you can see the Workload is scaling up, and the newly-created pods are scheduled to the fixed resource pool first:
When the second traffic peak comes (higher), the fixed resource pool is insufficient due to the lack of resource, the Workload is scaling up to the elastic resource pool:
When the traffic peak gone, the Workload is scaling down, and the pods in the elastic resource pool are deleted firstly: