GameServer Monitor
Metrics available
OKG by default exposes game server related Prometheus metrics, including:
| Name | Description | Type |
|---|---|---|
| GameServersStateCount | Number of game servers in different states | gauge |
| GameServersOpsStateCount | Number of game servers in different ops states | gauge |
| GameServersTotal | Total number of game servers that have existed | counter |
| GameServerSetsReplicasCount | Number of replicas for each GameServerSet | gauge |
| GameServerDeletionPriority | Deletion priority for game servers | gauge |
| GameServerUpdatePriority | Update priority for game servers | gauge |
Monitoring Dashboard
Dashboard Import
- Import grafana.json to Grafana
- Choose data source
- Replace UID and complete the import
Dashboard Introduction
The imported dashboard is shown below:
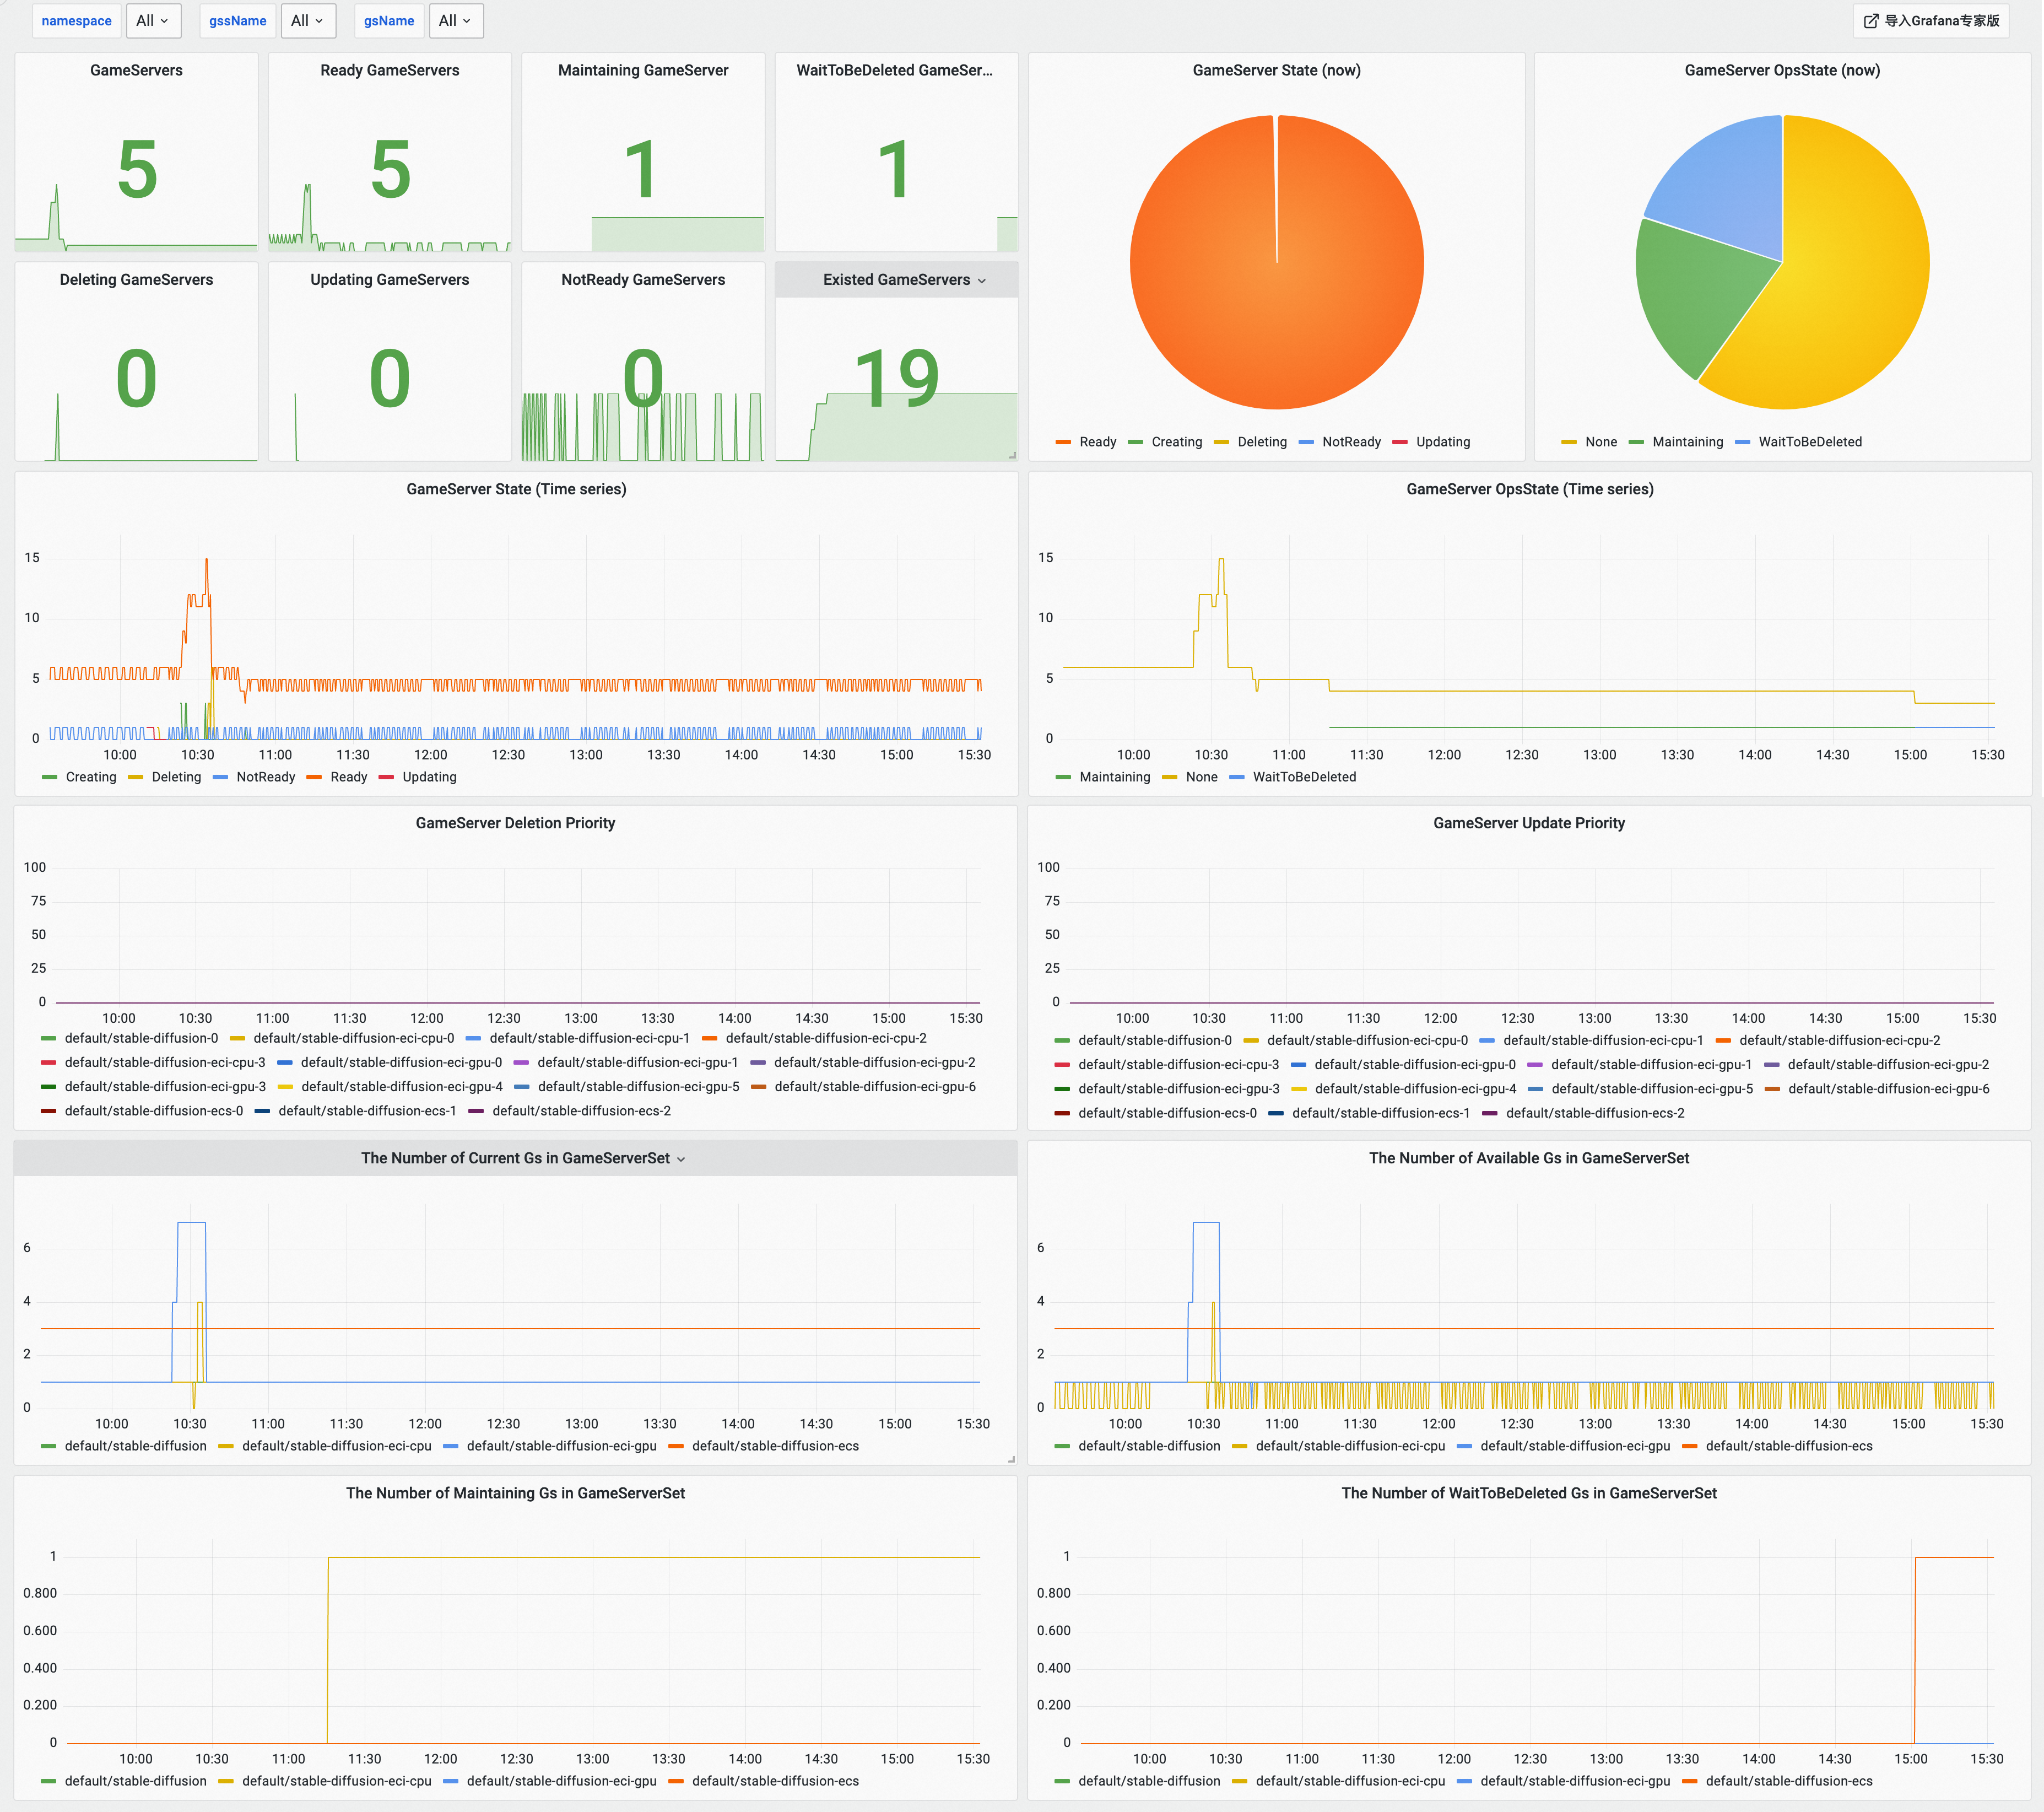
From top to bottom, it includes:
- First row: number of GameServers in each current state, and a pie chart showing the proportion of GameServers in each current state
- Second row: line chart showing the number of GameServers in each state over time
- Third row: line chart showing the changes in deletion and update priorities for GameServers (can be filtered by namespace and gsName in the top-left corner)
- Fourth and fifth rows: line charts showing the number of GameServers in different states for each GameServerSet (can be filtered by namespace and gssName in the top-left corner)
GameServer Ready Duration
Since v1.1.0, OKG records the time it takes for a GameServer to become Ready and Network Ready:
- Ready Duration: Time from GameServer creation to the Ready state.
- Network Ready Duration: Time from GameServer creation to the network becoming ready.
These durations are recorded in the GameServer status and can be used to monitor provisioning performance and detect network plugin latency issues.